> ## Documentation Index
> Fetch the complete documentation index at: https://laminarai-docs-lam-1786-dataset-cli-lmnr-cli.mintlify.site/llms.txt
> Use this file to discover all available pages before exploring further.
# How the Debugger Runs
This is the loop your coding agent runs for you. With the [Laminar skill](https://github.com/lmnr-ai/lmnr-skills) installed, Claude Code, Cursor, or Codex drives every step below on its own: it records a run, names and annotates the session, inspects the traces with SQL, replays from a checkpoint to iterate fast, and runs an eval to prove the fix. Each step is also a plain CLI command or environment variable, so you can run any step by hand or take over at any point. Make sure you've completed [setup](/debugger/setup) first. To see all six steps applied to one real bug with real outputs, follow the [end-to-end guide](/guides/debugger-end-to-end).
## See your agent runs in browser
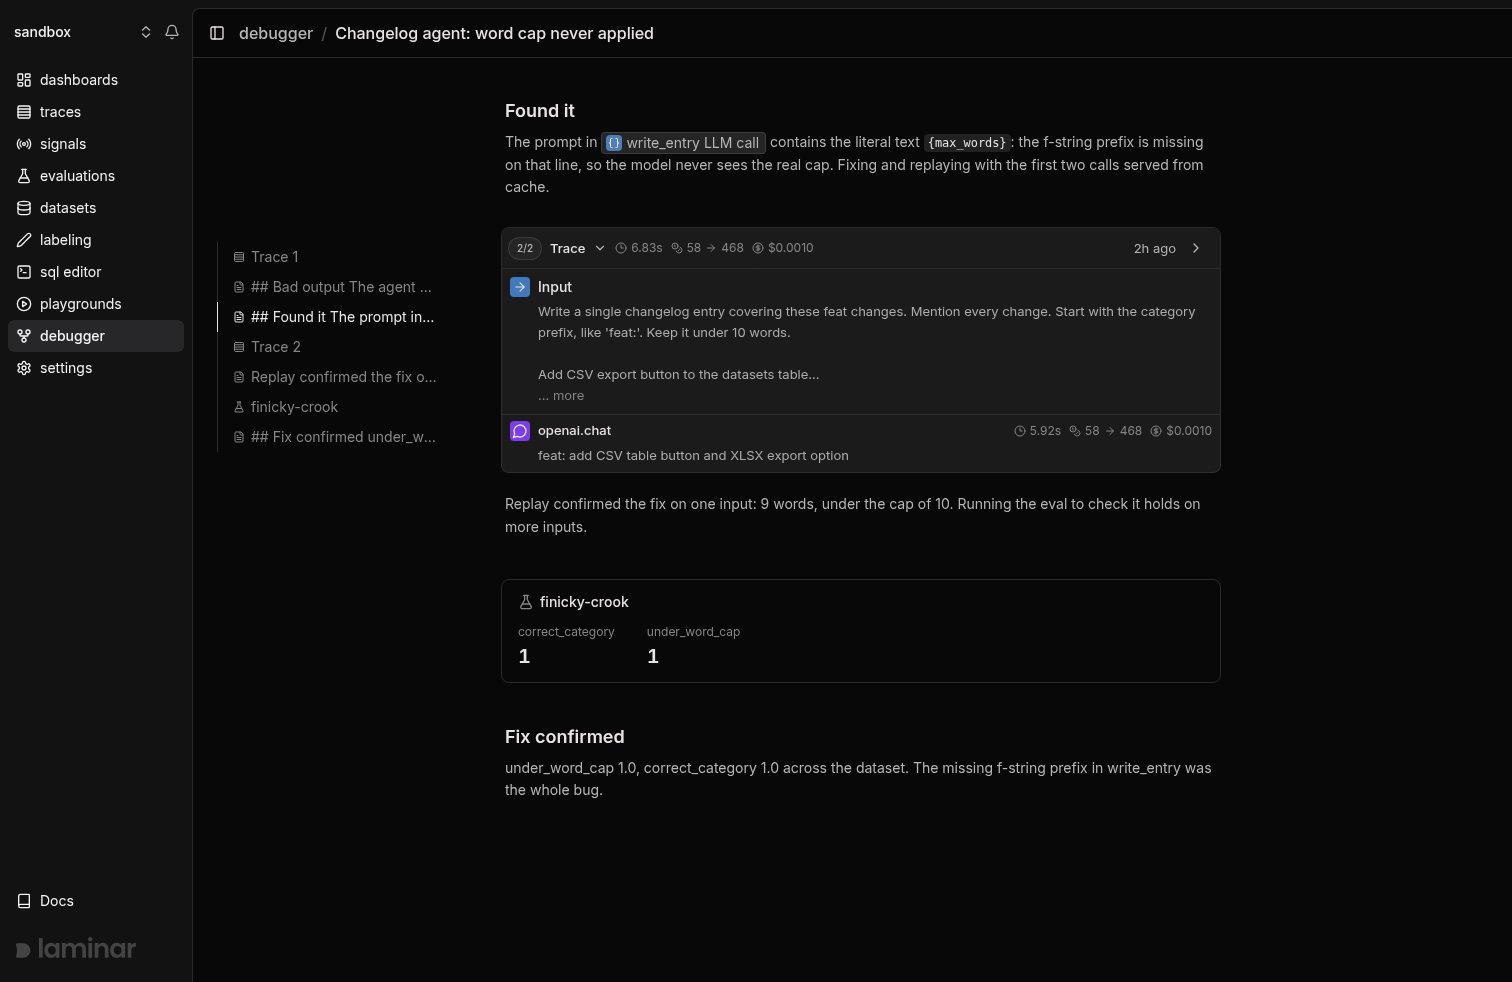
Watch your agent work from the Laminar UI while it drives the loop from the terminal. Open **Debugger** in your project and select the session, or click the `debugger_url` the SDK prints (it opens automatically when a debug run starts).
A session is a timeline of blocks: runs (traces), evaluations, and notes, interleaved by time. The view streams every block live as your coding agent works. Each run renders Laminar's auto-extracted user inputs, LLM turns, tool calls, and collapsed sub-agent cards. Evals render as cards with per-score averages, and notes render as markdown between them, so you can follow the agent's reasoning in real time.
 ## 1. Record a run
Add `LMNR_DEBUG=true` to your agent's run command:
```bash theme={null}
LMNR_DEBUG=true npx tsx my_agent.ts 2>&1 | tee run.log
grep 'LMNR_DEBUG_RUN' run.log
```
```bash theme={null}
LMNR_DEBUG=true python my_agent.py 2>&1 | tee run.log
grep 'LMNR_DEBUG_RUN' run.log
```
On startup the SDK registers a new debug session with Laminar, logs the session's `debugger_url`, opens it in your browser, and writes `.lmnr/debug-session.json` in the working directory. When the run finishes, the SDK prints a `LMNR_DEBUG_RUN` line with the run's ids. Always pipe stdout/stderr and grep for it explicitly, since other output will drown it.
The JSON on that line looks like:
```json theme={null}
{
"session_id": "…",
"trace_id": "…",
"replay_trace_id": null,
"cache_until": null,
"debugger_url": "https://laminar.sh/project//debugger-sessions/",
"started_at": "…"
}
```
You don't need to copy any of these ids. The same payload is saved to `.lmnr/debug-session.json`, and every later `LMNR_DEBUG=true` run in this directory (or any subdirectory) reads that file and rejoins the same session automatically (no browser reopens). Your traces stay grouped without passing a session id around.
Continuation is not replay. Rejoining the session records another fresh run; it does not replay the previous trace. Replay is armed explicitly in [step 4](#4-replay-to-iterate-fast). To start a clean session instead of continuing, run `npx lmnr-cli debug session new`, which mints a new session and resets the file.
## 2. Name the session and write notes
Name the investigation so it's easy to find later. Click the session title in the session-view header and type a name inline, or set it from the CLI. The CLI commands below target the session in `.lmnr/debug-session.json` by default, so you don't pass a session id:
```bash theme={null}
npx lmnr-cli debug session set-name "Fix report length + search tool"
```
Write a note before each run to explain what you are about to test, and another after it with what the run showed:
```bash theme={null}
npx lmnr-cli debug session add-note "## Testing the length cap
Replaying calls 1-3, running call 4 live with the new cap."
LMNR_DEBUG=true npx tsx my_agent.ts 2>&1 | tee run.log
npx lmnr-cli debug session add-note "## What this run showed
Length cap is working (~180 words, was ~600). Next: check citations."
```
Notes are markdown. Each `add-note` call adds a standalone note to the session, slotted into the timeline at the moment it was written, between the runs and evals it comments on. The human watching the session view sees your notes appear live, in order, without opening a terminal.
In notes, reference a specific span with an XML tag. The UI renders it as a clickable chip that opens that span:
```text theme={null}
```
Get the span id from the session view (hover the span row and click **Copy span ID**) or from a SQL query.
## 3. Inspect with SQL
Query the session's traces from the CLI:
```bash theme={null}
npx lmnr-cli sql query "
SELECT id AS trace_id, start_time, status, total_tokens
FROM traces
WHERE simpleJSONExtractString(metadata, 'rollout.session_id') = ''
ORDER BY start_time DESC
LIMIT 10"
```
Locate the bad span:
```bash theme={null}
npx lmnr-cli sql query "
SELECT span_id, name, span_type, start_time, status
FROM spans
WHERE trace_id = ''
ORDER BY start_time ASC"
```
`span_type` is `LLM`, `TOOL`, `DEFAULT`, or `CACHED` (a replayed call in a replay run). Find the LLM call **before** the buggy one; its `span_id` is the replay boundary you'll pass as `LMNR_DEBUG_CACHE_UNTIL`.
Run `npx lmnr-cli sql schema` to see all available tables.
## 4. Replay to iterate fast
After editing the agent, re-run with replay:
```bash theme={null}
LMNR_DEBUG=true \
LMNR_DEBUG_REPLAY_TRACE_ID= \
LMNR_DEBUG_CACHE_UNTIL= \
npx tsx my_agent.ts 2>&1 | tee run.log
grep 'LMNR_DEBUG_RUN' run.log
```
The run rejoins the session automatically, so you only set the replay variables. `LMNR_DEBUG_REPLAY_TRACE_ID` is the `trace_id` from the run you want to replay. `LMNR_DEBUG_CACHE_UNTIL` is the span id of the last LLM call to replay: the debugger serves cached responses through that call (inclusive) and runs live past it. Pass the id of the call **before** the buggy one, and the debugger runs your fix live while caching everything before it. See [how caching works](/debugger/caching) for the lookup mechanism.
Each replay produces a new trace in the same session, so attempts appear sequentially in the UI.
A replay run persists `replay_trace_id` and `cache_until` into `.lmnr/debug-session.json`, so subsequent `LMNR_DEBUG=true` runs in the same directory replay against the same trace without re-passing the env vars. Env vars always override the file per field. `npx lmnr-cli debug session new` clears the replay state along with minting a fresh session.
## 5. Prove the fix with an eval
A replay shows the fix works on one input. To show it holds in general, run your [evaluation](/evaluations/introduction) under the same debug session:
```bash theme={null}
LMNR_DEBUG=true npx lmnr eval my_agent.eval.ts
```
```bash theme={null}
LMNR_DEBUG=true lmnr eval my_agent_eval.py
```
There is no eval-specific setup: any Laminar evaluation run with `LMNR_DEBUG=true` resolves the session from `.lmnr/debug-session.json` the same way agent runs do, and links itself to it. The eval appears in the session timeline as a card showing its name and per-score averages. When the session contains more than one eval, each score also shows its change against the previous eval, green for up, red for down, so *did the fix move the numbers* is answered at a glance. Click the card to open the full evaluation with its datapoints and traces.
A typical closing sequence: note what you're about to verify, run the eval, note the outcome.
```bash theme={null}
npx lmnr-cli debug session add-note "Running the report-quality eval to confirm the length fix."
LMNR_DEBUG=true npx lmnr eval report_quality.eval.ts
npx lmnr-cli debug session add-note "Accuracy 0.82 → 0.91, length_ok 1.0. Fix confirmed."
```
## 6. Re-orient with a session summary
After a context reset or to catch up on an ongoing session, dump the session's full timeline:
```bash theme={null}
npx lmnr-cli debug session summary
npx lmnr-cli debug session summary --json
```
This defaults to the current session; pass `--session-id ` for another. Output is one entry per block, oldest first: traces and evals print as self-closing tags you can feed into SQL queries, and notes print as their raw markdown.
```text theme={null}
## Testing the length cap
Replaying calls 1-3, running call 4 live with the new cap.
Accuracy 0.82 → 0.91, length_ok 1.0. Fix confirmed.
```
This is the same timeline the session view renders, so a coding agent that reads the summary and a human who watches the browser see the same story.
## What's next
Read the full transcript view: inputs, LLM turns, tool calls, and sub-agent cards.
Write the evals the debugger runs: datapoints, executors, and evaluators.
Query spans, traces, and signal events with ClickHouse SQL directly in the browser.
Full reference for `lmnr-cli sql`, `dataset`, and `debug session` commands.
## 1. Record a run
Add `LMNR_DEBUG=true` to your agent's run command:
```bash theme={null}
LMNR_DEBUG=true npx tsx my_agent.ts 2>&1 | tee run.log
grep 'LMNR_DEBUG_RUN' run.log
```
```bash theme={null}
LMNR_DEBUG=true python my_agent.py 2>&1 | tee run.log
grep 'LMNR_DEBUG_RUN' run.log
```
On startup the SDK registers a new debug session with Laminar, logs the session's `debugger_url`, opens it in your browser, and writes `.lmnr/debug-session.json` in the working directory. When the run finishes, the SDK prints a `LMNR_DEBUG_RUN` line with the run's ids. Always pipe stdout/stderr and grep for it explicitly, since other output will drown it.
The JSON on that line looks like:
```json theme={null}
{
"session_id": "…",
"trace_id": "…",
"replay_trace_id": null,
"cache_until": null,
"debugger_url": "https://laminar.sh/project//debugger-sessions/",
"started_at": "…"
}
```
You don't need to copy any of these ids. The same payload is saved to `.lmnr/debug-session.json`, and every later `LMNR_DEBUG=true` run in this directory (or any subdirectory) reads that file and rejoins the same session automatically (no browser reopens). Your traces stay grouped without passing a session id around.
Continuation is not replay. Rejoining the session records another fresh run; it does not replay the previous trace. Replay is armed explicitly in [step 4](#4-replay-to-iterate-fast). To start a clean session instead of continuing, run `npx lmnr-cli debug session new`, which mints a new session and resets the file.
## 2. Name the session and write notes
Name the investigation so it's easy to find later. Click the session title in the session-view header and type a name inline, or set it from the CLI. The CLI commands below target the session in `.lmnr/debug-session.json` by default, so you don't pass a session id:
```bash theme={null}
npx lmnr-cli debug session set-name "Fix report length + search tool"
```
Write a note before each run to explain what you are about to test, and another after it with what the run showed:
```bash theme={null}
npx lmnr-cli debug session add-note "## Testing the length cap
Replaying calls 1-3, running call 4 live with the new cap."
LMNR_DEBUG=true npx tsx my_agent.ts 2>&1 | tee run.log
npx lmnr-cli debug session add-note "## What this run showed
Length cap is working (~180 words, was ~600). Next: check citations."
```
Notes are markdown. Each `add-note` call adds a standalone note to the session, slotted into the timeline at the moment it was written, between the runs and evals it comments on. The human watching the session view sees your notes appear live, in order, without opening a terminal.
In notes, reference a specific span with an XML tag. The UI renders it as a clickable chip that opens that span:
```text theme={null}
```
Get the span id from the session view (hover the span row and click **Copy span ID**) or from a SQL query.
## 3. Inspect with SQL
Query the session's traces from the CLI:
```bash theme={null}
npx lmnr-cli sql query "
SELECT id AS trace_id, start_time, status, total_tokens
FROM traces
WHERE simpleJSONExtractString(metadata, 'rollout.session_id') = ''
ORDER BY start_time DESC
LIMIT 10"
```
Locate the bad span:
```bash theme={null}
npx lmnr-cli sql query "
SELECT span_id, name, span_type, start_time, status
FROM spans
WHERE trace_id = ''
ORDER BY start_time ASC"
```
`span_type` is `LLM`, `TOOL`, `DEFAULT`, or `CACHED` (a replayed call in a replay run). Find the LLM call **before** the buggy one; its `span_id` is the replay boundary you'll pass as `LMNR_DEBUG_CACHE_UNTIL`.
Run `npx lmnr-cli sql schema` to see all available tables.
## 4. Replay to iterate fast
After editing the agent, re-run with replay:
```bash theme={null}
LMNR_DEBUG=true \
LMNR_DEBUG_REPLAY_TRACE_ID= \
LMNR_DEBUG_CACHE_UNTIL= \
npx tsx my_agent.ts 2>&1 | tee run.log
grep 'LMNR_DEBUG_RUN' run.log
```
The run rejoins the session automatically, so you only set the replay variables. `LMNR_DEBUG_REPLAY_TRACE_ID` is the `trace_id` from the run you want to replay. `LMNR_DEBUG_CACHE_UNTIL` is the span id of the last LLM call to replay: the debugger serves cached responses through that call (inclusive) and runs live past it. Pass the id of the call **before** the buggy one, and the debugger runs your fix live while caching everything before it. See [how caching works](/debugger/caching) for the lookup mechanism.
Each replay produces a new trace in the same session, so attempts appear sequentially in the UI.
A replay run persists `replay_trace_id` and `cache_until` into `.lmnr/debug-session.json`, so subsequent `LMNR_DEBUG=true` runs in the same directory replay against the same trace without re-passing the env vars. Env vars always override the file per field. `npx lmnr-cli debug session new` clears the replay state along with minting a fresh session.
## 5. Prove the fix with an eval
A replay shows the fix works on one input. To show it holds in general, run your [evaluation](/evaluations/introduction) under the same debug session:
```bash theme={null}
LMNR_DEBUG=true npx lmnr eval my_agent.eval.ts
```
```bash theme={null}
LMNR_DEBUG=true lmnr eval my_agent_eval.py
```
There is no eval-specific setup: any Laminar evaluation run with `LMNR_DEBUG=true` resolves the session from `.lmnr/debug-session.json` the same way agent runs do, and links itself to it. The eval appears in the session timeline as a card showing its name and per-score averages. When the session contains more than one eval, each score also shows its change against the previous eval, green for up, red for down, so *did the fix move the numbers* is answered at a glance. Click the card to open the full evaluation with its datapoints and traces.
A typical closing sequence: note what you're about to verify, run the eval, note the outcome.
```bash theme={null}
npx lmnr-cli debug session add-note "Running the report-quality eval to confirm the length fix."
LMNR_DEBUG=true npx lmnr eval report_quality.eval.ts
npx lmnr-cli debug session add-note "Accuracy 0.82 → 0.91, length_ok 1.0. Fix confirmed."
```
## 6. Re-orient with a session summary
After a context reset or to catch up on an ongoing session, dump the session's full timeline:
```bash theme={null}
npx lmnr-cli debug session summary
npx lmnr-cli debug session summary --json
```
This defaults to the current session; pass `--session-id ` for another. Output is one entry per block, oldest first: traces and evals print as self-closing tags you can feed into SQL queries, and notes print as their raw markdown.
```text theme={null}
## Testing the length cap
Replaying calls 1-3, running call 4 live with the new cap.
Accuracy 0.82 → 0.91, length_ok 1.0. Fix confirmed.
```
This is the same timeline the session view renders, so a coding agent that reads the summary and a human who watches the browser see the same story.
## What's next
Read the full transcript view: inputs, LLM turns, tool calls, and sub-agent cards.
Write the evals the debugger runs: datapoints, executors, and evaluators.
Query spans, traces, and signal events with ClickHouse SQL directly in the browser.
Full reference for `lmnr-cli sql`, `dataset`, and `debug session` commands.